Genesis Global Group
PharmOptima
GD3

You will now be redirected to the GD3 website

PharmOptima is a proud member of Genesis Drug Discovery & Development (GD3), a fully integrated CRO providing services to support drug discovery programs of our clients from target discovery through IND filing and managing Phase I-III clinical trials.

Learn more about GD3
Search

SERVICES

Nerve Crush Illustration
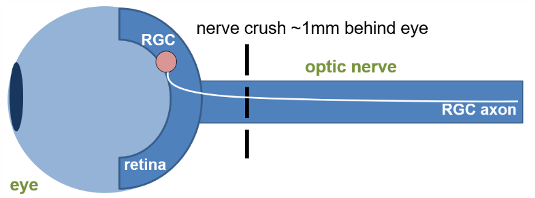
Figure 1. Schematic representation of the method of induction.

Glaucoma is a collection of diseases that lead to irreversible vision loss as a result of retinal ganglion cell (RGC) death and their subsequent inability to transmit information to the visual cortex.1 The optic nerve crush (ONC) surgical model involves a precise and consistent injury to the optic nerve, thereby leading to the RGC death that is consistent with glaucoma and other neurodegenerative disorders of the retina. Using reliable in-life and post-life readouts gives us insight into disease pathology and can shed light on potential therapeutics.

Animal Species Mouse
Method of Induction Crush injury to optic nerve using forceps
Follow up Period Acutely following injury through 4-6 weeks
Route of intervention Intravitreal, intracameral, topical, systemic
Readouts
  • Electroretinograms
  • Optical coherence tomography
  • Ocular examinations by board-certified veterinary ophthalmologist
  • Immunofluorescence, immunohistochemistry and H&E staining
  • Biomarker analysis via qPCR or ligand binding assay

Central nervous system trauma and neurodegenerative disorders can trigger a cascade of cellular and molecular events culminating in neuronal apoptosis. The Optic Nerve Crush model provides an effective tool for analyzing the pathogenic mechanisms associated with neuronal injury signaling in vivo. Optic nerve crush has been used as a model neuronal injury, including glaucoma, traumatic optic neuropathies, neurodegeneration and CNS injury. Crush injury to the optic nerve severs the retinal ganglion cell (RGC) axons leading to the gradual death of RGC neurons in the retina. The model provides an opportunity to study neuronal outcomes following injury, including survival, apoptosis, regeneration and associated biomarkers. Applications include traumatic optic neuropathy, glaucoma and neurodegenerative disease.

Optic nerve crush serves as a useful model for traumatic optic neuropathy and mimics glaucomatous injury, similarly inducing RGC cell death and degeneration. Glaucomatous injury is a pathohistological feature of glaucoma in the optic nerve.

Molecular Readouts Illustration Model Induction

Multidimensional observations strengthen the interpretation: in addition to in-life measurements (i.e., ERG), Immunostaining monitors therapeutic effect, immunoassays track biomarkers, and qRT-PCR provides information on retinal gene expression. Markers tracked in this model include:

Proten/Gene Significance
pcJun neuronal injury
TUJI RGC marker
Atf3 regeneration-associated genes
Sprr1a regeneration-associated genes
Ddit3 (Chop) pro-apoptotic transcription factor
Gfap Reactive astrocyte marker

Treating and Reversing Glaucoma

The GD3 Ocular Center of Excellence is proud to offer efficacy models in which physiological readouts coupled with cellular and biochemical measurements provide a comprehensive snapshot of your treatment's therapeutic potential. The optic nerve crush model can test agents treating glaucoma, traumatic optic neuropathies, neurodegeneration, and CNS injury and inflammation. If your organization is working to treat any of these debilitating diseases, we encourage you to examine our capabilities:

  • Glaucoma
  • In vivo Mouse Model for Glaucoma
  • Traumatic Optic Neuropathies
  • CNS Injury
  • Inflammation
  • Neurodegenerative Diseases

Readouts

Activation of Signaling Pathways

Activation of Signaling Pathways

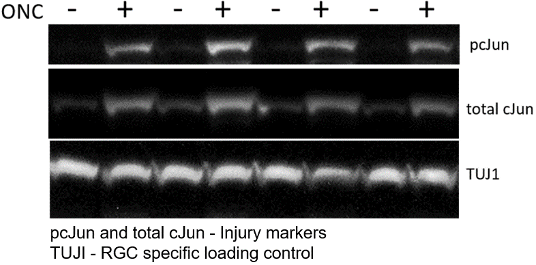
Western blot of retinal tissue three days following optic nerve crush compared to uninjured control: upregulation of injury marker, pcJun, demonstrates activation of signaling pathways important for neuronal outcome following ONC.

Injury Markers Illustration
Figure 2. Western blot of retinal tissue 3 days following optic nerve crush (ONC) compared to uninjured control: upregulation of injury marker, pcJun, demonstrates activation of signaling pathways important for neuronal outcome following ONC. Upregulation of Injury Markers

Upregulation of Injury Markers

Upregulation of Injury Markers

Immunostained whole mount retinas following optic nerve crush (ONC): upregulation of injury marker, pcJun, demonstrates activation of injury signaling pathways resulting in retinal ganglion cell (RGC) death following ONC. Loss of pcJun and TUJI signal three weeks after ONC demonstrates a reduction in the number of surviving RGCs in the weeks following axotomy.

Post ONC Illustration
Figure 3: Whole mount retinas immunostained for TUJ1 and pcJun. Expression of pcJun following ONC demonstrates activation of MAPK injury signaling pathways.

Robust Transcriptional Response

Robust Transcriptional Response

qRT-PCR of Atf3, Sprr1a, Ddit3 (Chop), and Gfap from retinal RNA four days after optic nerve crush (ONC) compared to uninjured contralateral control (CTL): upregulation of regeneration-associated genes Atf3 and Sprr1a, pro-apoptotic transcription factor Ddit3 (Chop), and reactive astrocyte marker Gfap demonstrates a robust response to injury following ONC. Relative gene expression was calculated using the ΔΔCT method relative to Gapdh and normalized to expression levels in CTL samples.

Injury Markers Illustration
Figure 4. Upregulation of injury markers in mouse retina following optic nerve crush. qRT-PCR of Atf3, Sprr1a, Ddit3 (Chop), and Gfap from retinal RNA four days after optic nerve crush (ONC) compared to uninjured contralateral control (CTL). Upregulation of regeneration-associated genes Atf3 and Sprr1a, pro-apoptotic transcription factor Ddit3 (Chop), and reactive astrocyte marker Gfap demonstrates robust response to injury following ONC. Relative gene expression was calculated using the ΔΔCT method with Gapdh and normalized to expression levels in CTL samples.

Scotopic Threshold Response (STR)

Scotopic Threshold Response (STR)

Scotopic Threshold Response (STR)
Figure 5.The scotopic threshold response (STR) is the most sensitive response in the dark-adapted ERG. Since this response originates from the inner retina, this test can be used to assess RGC function non-invasively.

Scotopic Threshold Response (STR)
Figure 6. Positive scotopic threshold response (pSTR) results demonstrate a decrease in RGC response in pSTR from both a group (n=10) analyses (left) and individual ERG tracings (right) through 32 days following ONC injury.
Figure 7. Analysis of whole mount retinas immunostained for Brn3a, RBPMS and DAPI (right) demonstrating a decrease in RGC survival 4 weeks following ONC injury (left).
Figure 8. Biomarker analysis from terminal plasma samples following ONC demonstrate an increase in NfL, IL-6 and MCP-1.

Optical Coherence Tomography (OCT) Imaging

Optical Coherence Tomography (OCT) Imaging

Injury Markers Illustration
Figure 9. Histological section of an A) control mouse retina and a B) mouse retina 4 weeks following optic nerve crush surgery. Arrows highlight the ganglion cell layer.

References

  1. Larhammar et al. 2017. Dual leucine zipper kinase-dependent PERK activation contributes to neuronal degeneration following insult. eLife 6:e20725.
  2. Li et al. 2020. Longitudinal Morphological and Functional Assessment of RGC Neurodegeneration After Optic Nerve Crush in Mouse. Front Cell Neurosci. 14(109).
  3. Tang et al. 2011. An Optic Nerve Crush Injury Murine Model to Study Retinal Ganglion Cell Survival. J Vis Exp. (50):2685.
Injury Markers Illustration
Figure 10. OCT imaging allows for longitudinal cross-section scans of the retina to be collected. These scans allow for the measurement of retinal thickness, which sheds light on changes in the ganglion cell layer following optic nerve crush.

Optic Nerve Crush Use in Your Research Program

Optic nerve crush allows for the evaluation of drug intervention following neuronal injury at the cellular and biochemical levels. Immunostaining can monitor therapeutic effects, and immunoassays can be developed to track biomarkers following treatment.